2.2.1 - Graph Search
Define start and goal points. Our library directly represents coordinate points using tuples. In discrete grid map frame, the values in the tuple are integers. If it is in world frame, they are floating-point numbers.
Add the start and goal points to the map. This is to help the visualization of the start and goal points, and to clear obstacles at corresponding points to prevent planning failures.
Create the path-planner and plan the path. Here, the A* algorithm is taken as an example. The planning function returns the path in map frame along with detailed planning information, including whether it was successful, the length of the path, the cost of the path, expanded nodes, and so on.
planner = AStar(map_=map_, start=start, goal=goal)
path, path_info = planner.plan()
print(path)
print(path_info)
Print results:
[(25, 5, 5), (24, 6, 6), (23, 7, 7), (22, 7, 8), (21, 7, 9), (20, 7, 10), (19, 7, 10), (18, 7, 11), (17, 7, 12), (16, 8, 13), (15, 9, 14), (14, 9, 15), (13, 10, 16), (12, 11, 17), (11, 12, 18), (10, 12, 18), (9, 13, 19), (9, 14, 19), (8, 15, 20), (7, 16, 21), (6, 17, 22), (5, 18, 23), (5, 19, 23), (5, 20, 23), (5, 21, 23), (5, 22, 23), (5, 23, 24), (5, 24, 25), (5, 25, 25)]
{'success': True, 'start': (25, 5, 5), 'goal': (5, 25, 25), 'length': 40.09831818981128, 'cost': 40.09831818981128, 'expand': {(25, 5, 5): Node((25, 5, 5), None, 0, 34.64101615137755), ...}}
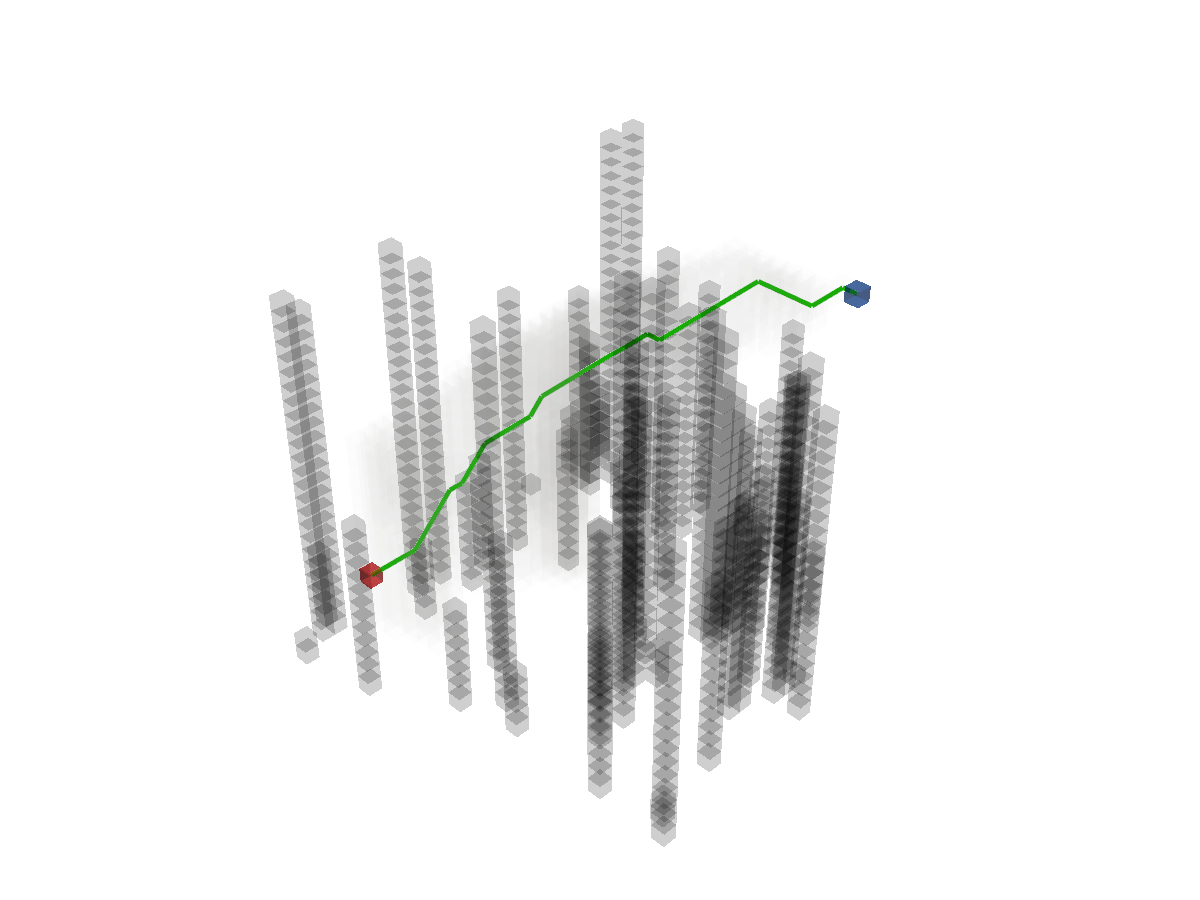
Visualize.
map_.fill_expands(path_info["expand"])
vis = Visualizer3D()
vis.plot_grid_map(map_)
vis.plot_path(path)
vis.show()
vis.close()
Runnable complete code:
import random
random.seed(0)
import numpy as np
np.random.seed(0)
from python_motion_planning.common import *
from python_motion_planning.path_planner import *
from python_motion_planning.controller import *
map_ = Grid(bounds=[[0, 31], [0, 31], [0, 31]], resolution=1.0)
for i in range(75):
rd_p = tuple(np.random.randint(0, 30, size=3))
map_[rd_p[0], rd_p[1], :rd_p[2]] = TYPES.OBSTACLE
map_.inflate_obstacles(radius=3)
start = (25, 5, 5)
goal = (5, 25, 25)
map_[start] = TYPES.START
map_[goal] = TYPES.GOAL
planner = AStar(map_=map_, start=start, goal=goal)
path, path_info = planner.plan()
print(path)
print(path_info)
map_.fill_expands(path_info["expand"])
vis = Visualizer3D()
vis.plot_grid_map(map_)
vis.plot_path(path)
vis.show()
vis.close()
For more graph search planners and their arguments, please refer to API Reference.