2.1.1 - Grid
Fix the random seed to ensure reproducible results.
Import necessary modules.
from python_motion_planning.common import *
from python_motion_planning.path_planner import *
from python_motion_planning.controller import *
Define the grid map and add and inflate obstacles.
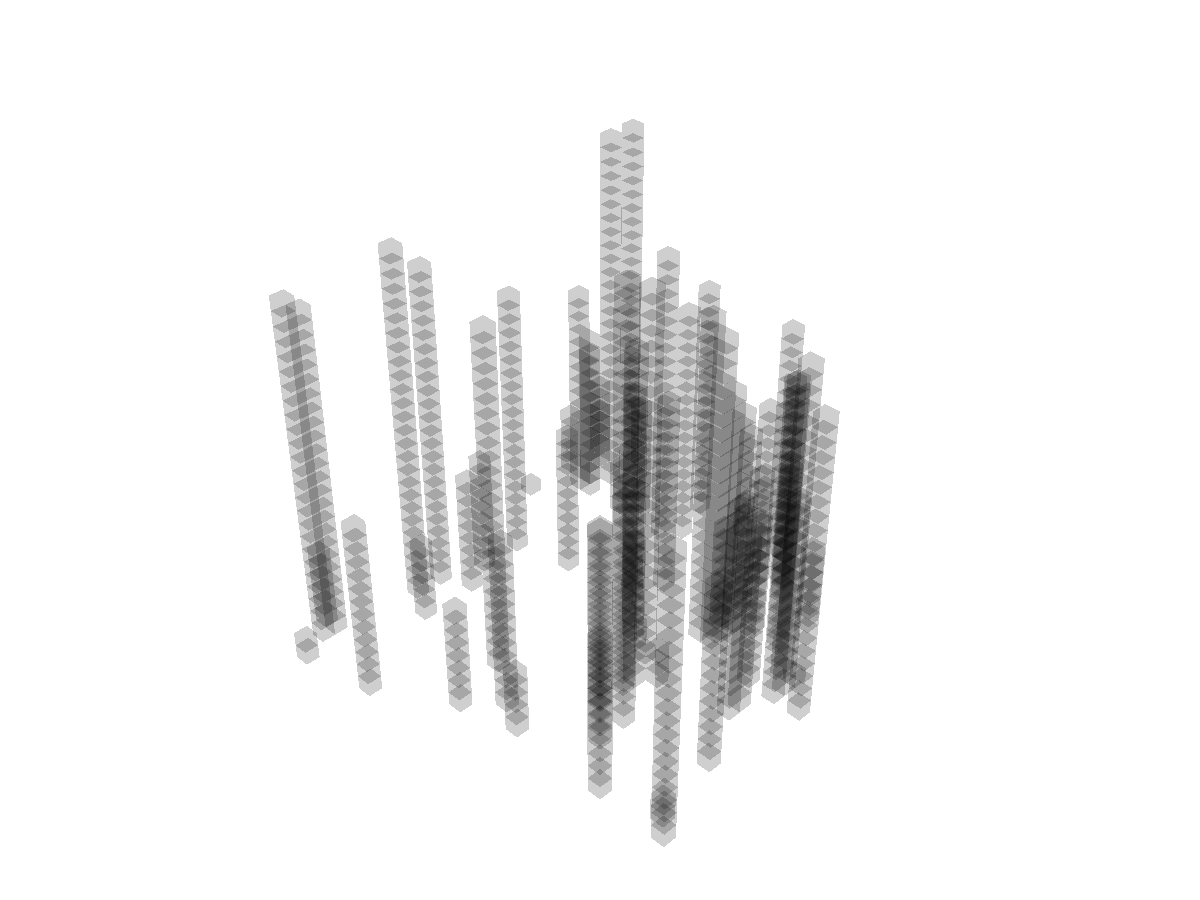
Grid map is the most commonly used map format in the field of path planning. The world frame is a global coordinate system representing the robot and environment in the real world, while the grid map frame is a local or discrete coordinate system used for grid-based maps, typically tied to map resolution and cell indices.
The bounds argument defines the range of the grid map in world frame. Then the size of the discrete grid map is then automatically calculated with the resolution argument. The default resolution of the Grid class is 1, so the calculated discrete size of the grid map is 31*31*31.
After creating the grid map, we add some obstacles to it for testing the path planners.
map_ = Grid(bounds=[[0, 31], [0, 31], [0, 31]], resolution=1.0)
for i in range(75): # 75 random obstacles
rd_p = tuple(np.random.randint(0, 30, size=3))
map_[rd_p[0], rd_p[1], :rd_p[2]] = TYPES.OBSTACLE
map_.inflate_obstacles(radius=3)
Visualize to check the map.
Runnable complete code:
import random
random.seed(0)

import numpy as np
np.random.seed(0)
from python_motion_planning.common import *
from python_motion_planning.path_planner import *
from python_motion_planning.controller import *
map_ = Grid(bounds=[[0, 31], [0, 31], [0, 31]], resolution=1.0)
for i in range(75):
rd_p = tuple(np.random.randint(0, 30, size=3))
map_[rd_p[0], rd_p[1], :rd_p[2]] = TYPES.OBSTACLE
map_.inflate_obstacles(radius=3)
vis = Visualizer3D()
vis.plot_grid_map(map_)
vis.show()
vis.close()
3D visualization is based on PyVista. If you want to save the figure, you need to set argument off_screen to True and comment vis.show(). Below is an example to save a figure: